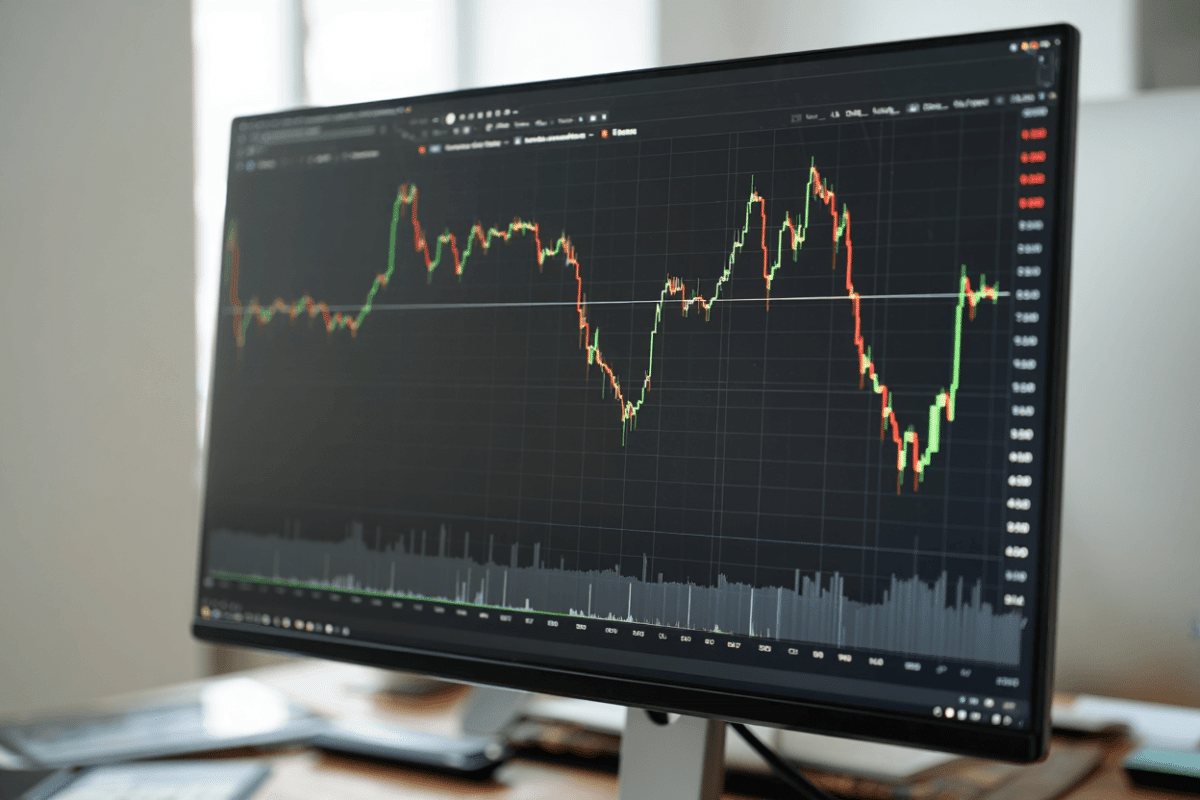
The CBOE Volatility Index surged today, hitting 18.25 amid fresh market uncertainty. This represents the highest level in five trading sessions, signaling investor concern about price swings ahead. What’s driving the fear, and should investors worry?
🔥 Quick Facts
- VIX Level: Rose to 18.25, marking the highest close in the past 5 sessions
- Fear Gauge: Often called Wall Street’s fear index, measuring S&P 500 options volatility
- 5.74% Jump: Thursday’s surge reflects heightened market uncertainty and investor caution
- Below 20: Still in comfortable range, but trending upward from mid-May lows
Why Is the VIX Climbing Right Now?
The Volatility Index doesn’t move in a vacuum. Market-moving events like earnings reports, geopolitical tensions, inflation data releases, and shifts in Fed policy can trigger sharp VIX spikes. Today’s 5.74% surge suggests investors are bracing for choppier markets.
When buyers sense danger ahead, they rush to purchase protective options on the S&P 500. This increased demand pushes option prices higher, which directly lifts the VIX. Rising options costs signal that traders expect bigger price swings in the coming month.
Understanding the Fear Gauge Machine
The CBOE Volatility Index measures the market’s expectation of 30-day forward volatility based on real-time S&P 500 index option prices. It’s calculated by the Chicago Board Options Exchange, America’s largest exchange for options trading.
The VIX doesn’t predict market direction, only the degree of expected price movement. When readings spike above 30, it signals extreme fear. Below 20 suggests calm conditions. At 18.25, today’s level reflects moderate unease, not panic.
| VIX Range | Market Sentiment |
| Below 15 | Extreme complacency |
| 15-20 | Normal, stable markets |
| 20-30 | Moderate concern present |
| Above 30 | Heightened fear, uncertainty |
“VIX values above 30 indicate greater market fear and uncertainty, while values below 20 suggest stability. Investors use VIX to assess market conditions and hedge portfolios.”
— Investopedia, Volatility Investing Guide
What Traders and Investors Are Watching Now
The inverse relationship between the VIX and the S&P 500 is crucial. As stock prices fall, investors grow nervous. This nervousness drives demand for protective options, pushing the VIX higher.
Today’s 18.25 reading sits comfortably above the mid-May lows near 16.55 but below the extreme levels seen in March 2026, when the VIX climbed closer to 25. This suggests a measured shift in market psychology rather than panic-driven selling.
This Week’s Fed Data and Market Impact
Recent economic releases often trigger volatility spikes. Inflation data, employment reports, and interest rate guidance can reshape investor outlook instantly.
The 5.74% jump in the VIX today indicates traders are taking fewer risks. Portfolio hedging, profit-taking, and rotation out of growth stocks all drive increased option buying, which feeds the volatility index upward.
Is the VIX Rise a Buying Opportunity or a Warning Signal?
Some market veterans argue that elevated VIX levels create bargain opportunities. When fear peaks, valuations compress, offering long-term investors attractive entry points.
Others treat rising volatility as a red flag to tighten stops and reduce exposure. The answer depends on your investment time horizon and risk tolerance. What matters most is understanding what the VIX actually measures and what constitutes a truly dangerous level in historical context.
Sources
- CBOE Global Markets – Official VIX volatility data and index information
- Investopedia – Comprehensive guide to volatility index interpretation
- Fidelity Singapore – Volatility gauge thresholds and investor implications