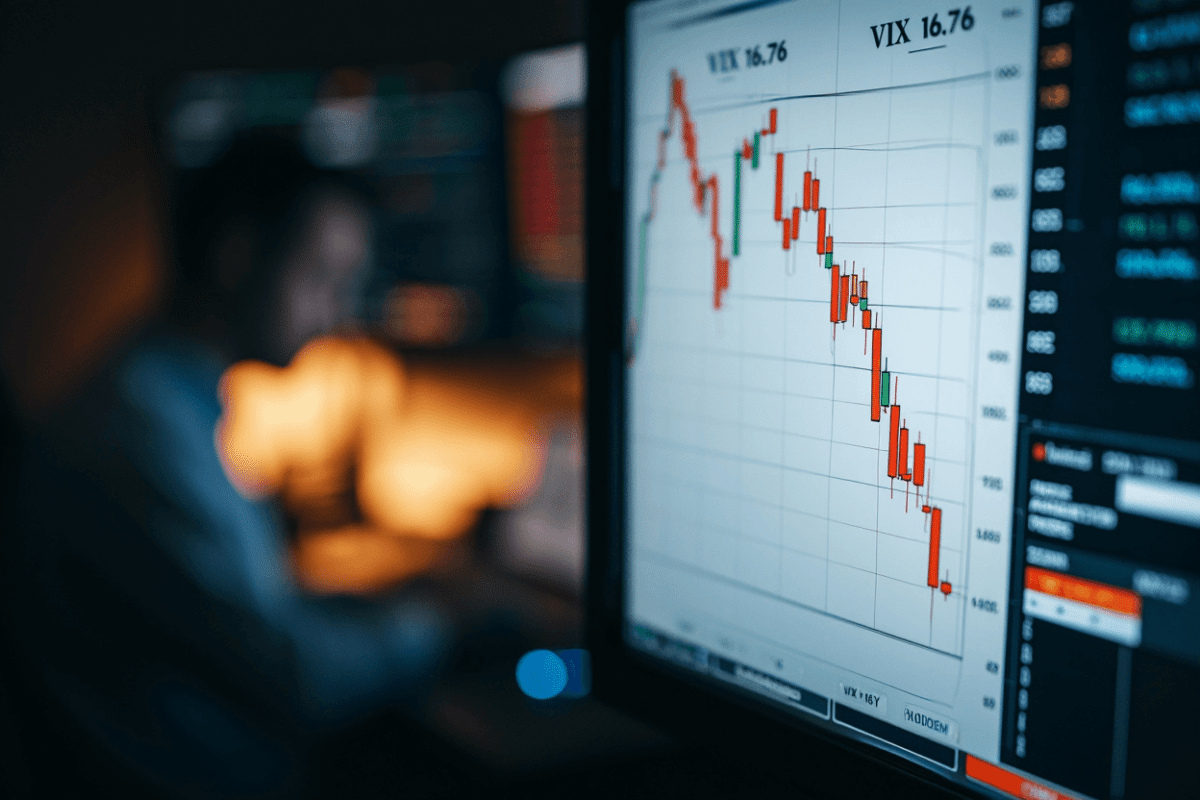
The CBOE Volatility Index (VIX) declined sharply on May 21, 2026, closing at 16.76—a 3.9% drop that signals meaningful relief in market anxiety. This decline marks a strong pullback from the elevated fear levels that gripped markets over the preceding two weeks, signaling investor confidence is stabilizing as geopolitical and economic uncertainties fade.
🔥 Quick Facts
- VIX closed at 16.76 on May 21, 2026 — down 3.9% from the previous session
- 16.76 falls squarely in the “stable market” zone — readings below 20 indicate low-volatility expectations
- Two-week volatility spike peaked above 19 points before rapid cooling began
- Current level suggests minimal fear priced into S&P 500 options for the next 30 days
Understanding VIX as a Fear Gauge
The Volatility Index (VIX) measures the 30-day implied volatility of S&P 500 Index options, calculated through the Chicago Board Options Exchange (CBOE). It reflects what institutional options traders are willing to pay to protect their portfolios, making it a direct proxy for forward-looking market uncertainty. When the VIX climbs above 20, it suggests traders are pricing in heightened risk. When it falls below 20, as today’s reading confirms, it indicates complacency and a return to normal market conditions.
The 16.76 level represents a return to historical “calm” expectations. For context, readings in the 12-16 range dominated much of 2024 and early 2025, only breaking higher when geopolitical surprises or economic data disappointments emerged.
The Two-Week Volatility Spike and Recovery Pattern
Starting around May 5-7, 2026, the VIX began drifting upward as multiple risk factors converged. Geopolitical tensions, unclear Iran negotiations, and inflation concerns sent the index to 19.25 on May 18—the two-week peak. This pattern aligns with Morningstar Chief US Market Strategist Dave Sekera’s assessment that 2026 would bring volatility pinpricks tied to Federal Reserve transitions, trade negotiations, and geopolitical flashpoints.
The rapid decline from May 19 (18.01) to May 21 (16.76) represents what market analysts call a “V-shaped recovery”—characterized by quick reversals when uncertainty factors begin to resolve. Recent reports suggesting successful Iran negotiations in final stages, combined with renewed corporate earnings optimism, helped restore investor conviction faster than expected.
What VIX Levels Now Tell Us About Market Risk
| VIX Range | Market Interpretation | Investor Stance |
| Below 15 | Extreme complacency; historic lows | Likely overconfidence |
| 15–20 | Healthy stability (Current: 16.76) | Balanced allocation appropriate |
| 20–30 | Elevated worry; moderate stress | Defensive positioning begins |
| Above 30 | Acute fear; systemic risk signals | Potential contrarian buy signals |
At 16.76, the VIX sits comfortably in the “sweet spot” zone—not so high as to signal panic, not so low as to suggest dangerous complacency. This level allows equity risk premiums to remain modest while warning investors that occasional volatility spikes remain priced in for the remainder of May and into June 2026.
“The VIX can help investors gauge market sentiment as well as volatility to identify investment opportunities. Lower readings signal more stable periods, but vigilance remains essential as geopolitical and macro surprises can ignite rapid reversals.”
— Chase Bank Investment Insights, Portfolio Management Perspective, May 2026
Implications for Portfolio Managers and Traders
The 3.9% decline in VIX volatility sends clear signals about shifting portfolio behavior. Recent earnings season catalysts are reducing uncertainty. Fixed-income traders can now expect tighter bid-ask spreads on long-duration bonds, while equity options writers are rotating from selling defensive puts toward neutral positions.
The quick recovery also underscores a critical insight for 2026: while markets will remain more volatile than the 2023–2024 period, structural support from strong corporate fundamentals and Federal Reserve policy accommodation prevents panic-level readings from persisting. When fear does spike, the window to capitalize on discounts often closes within 48–72 hours, exactly as May 18–21 demonstrated.
What Could Reignite Volatility Before Mid-June?
Investors should monitor three specific factors that could push the VIX above 18–20 again. First, unexpected inflation data arriving outside Fed expectations could trigger a sell-off in both stocks and bonds. Second, earnings misses by mega-cap technology firms—which remain central to S&P 500 valuations—could accelerate a repricing. Third, renewed geopolitical escalations or trade deal collapses could rapidly restore the fear premium already partially priced out after this week’s decline.
A VIX reading of 16.76 does not guarantee stability for the entire month ahead. Instead, it represents the current market consensus about manageable volatility through the immediate horizon. Proactive traders adjusting hedge ratios and long-dated option positions will likely find better entry prices in coming weeks if complacency deepens further.
Is This Bounce Sustainable, or Will Volatility Return?
Market history suggests that V-shaped VIX recoveries from 19-point peaks tend to hold roughly 60% of the time when driven by fundamental news resolution (like Iran talks progressing) rather than technical whipsaw. A consolidation in the 16–18 range through late May would signal institutional confidence. Any breach back above 19 would warrant renewed caution about larger forces building beneath the surface. Traders should revisit their option positions and portfolio hedges weekly as new catalysts emerge in the busy June earnings calendar and potential Federal Reserve communications.
Sources
- Yahoo Finance Historical Data — CBOE Volatility Index closing prices and percentage changes
- Chicago Board Options Exchange (CBOE) — Official VIX calculation methodology and real-time quotes
- Morningstar Investment Research — 2026 volatility risk factor analysis
- Chase Bank Wealth Management — Portfolio management guidance during volatility cycles
- Federal Reserve Economic Data (FRED) — Historical VIX trends and context