The 30-year Treasury bond yield surged to 5.15% on May 19, 2026, marking the week’s highest level as inflation concerns and geopolitical tensions reshape U.S. borrowing costs. The jump reflects persistent pricing pressure across the economy, with consumer prices rising 3.8% annually—the fastest pace since May 2023—while producer prices climbed 6% year-over-year. This article explains why rates are climbing, what triggers these movements, and what it means for the broader economy.
🔥 Quick Facts
- 30-year Treasury yield reached 5.15% on May 19, 2026, highest level of the week
- Consumer Price Index inflation at 3.8% annually, the highest rate since May 2023
- Producer Price Index rose 6% year-over-year, its peak since late 2022
- Federal Reserve Chair Kevin Warsh faces complex inflation picture with policy tensions between rate cuts and price stability
- Oil prices jumped to $104.39 per barrel (WTI) after Middle East tensions impact energy markets
Understanding 30-Year Treasury Bond Rates: Why They Matter
The 30-year Treasury bond represents one of the longest-term borrowing instruments available to the U.S. government. When yields rise, as they have this week, investors demand higher compensation for lending money to the government for three decades. This directly impacts mortgages, corporate bonds, and consumer lending rates throughout the economy.
Unlike shorter-term bonds, 30-year Treasuries are highly sensitive to inflation expectations. Investors worry that money promised 30 years from now will be worth less if prices keep rising. They’re also sensitive to long-term Federal Reserve policy expectations and deficit concerns. Higher yields signal market participants believe inflation will remain elevated or that fiscal imbalances require compensation for inflation risk.
The Inflation Catalyst: Recent Economic Data Signals Persistent Pricing Pressure
The yield surge this week stems directly from hot inflation data released Wednesday and Thursday. The Consumer Price Index (CPI) clocked 3.8% on an annual basis—significantly above the Federal Reserve’s 2% target. This represents the fastest annual pace since May 2023, indicating that price pressures are accelerating rather than cooling.
Even more concerning for market participants, producer prices—which measure wholesale costs and signal pipeline inflation—came in at 6% annually, matching the highest rate since late 2022. This matters because producer price increases often precede consumer price increases. Import costs surged 1.9% for April alone and 4.2% annually, marking the largest annual increase since October 2022. These cost pressures will likely push downstream to consumers in coming months.
Historical Rate Comparison and Market Context
To understand where rates stand now, comparing historical context reveals the story:
| Treasury Instrument | May 19, 2026 Yield | Highest Since | Long-Term Average |
| 30-Year Treasury | 5.15% | May 22, 2025 | 6.16% |
| 10-Year Treasury | 4.59% | February 2025 | 4.25% |
| 2-Year Treasury | 4.09% | February 2025 | 3.85% |
| Federal Funds Rate | 3.50%-3.75% | Unchanged since April 2026 | Historical average: 4.50% |
The data reveals important dynamics. The 30-year yield of 5.15% sits below the long-term average of 6.16%, suggesting rates aren’t at historical extremes. However, rates are rising faster than expected, with the May 15 jump to 5.121% marking the highest level in nearly a year. The yield curve suggests persistent economic uncertainty—the 2-year is nearly as high as the 10-year, indicating markets expect either sustained inflation or rates to stay elevated longer.
What Drives 30-Year Treasury Rates? Three Critical Mechanisms
Inflation Expectations form the primary driver. When inflation rises above expectations, bond investors sell existing bonds and demand higher yields on new ones. The 3.8% CPI reading vs. 2% Fed target creates a significant risk premium that shows up in higher yields.
Federal Reserve Policy Expectations are the second major factor. New Federal Reserve Chair Kevin Warsh, confirmed Wednesday, faces pressure from President Trump for rate cuts even as inflation data worsens. Markets are pricing in uncertainty about the Fed’s next move. The Fed currently maintains the funds rate at 3.5%-3.75% but faces mounting tension between inflation control and interest rate cut expectations.
Geopolitical risks and energy prices form the third mechanism. Middle East tensions drove oil prices to $104.39 per barrel for WTI and $108.30 for Brent—increases that feed into inflation expectations. Higher energy costs propagate through transportation, manufacturing, and consumer goods prices.
“Long end rates are now in control of monetary policy. I wish Kevin Warsh the best, but he will still be subject to his surrounding macro circumstances. Inflation is still a problem, and debts and deficits matter.”
— Peter Boockvar, Chief Investment Officer, One Point BFG Wealth Partners
Implications for Mortgages, Savers, and the Economy
Mortgage Impact: The 30-year Treasury doesn’t directly determine mortgage rates, but it influences them strongly. Mortgage rates typically run about 2 percentage points higher than 30-year Treasuries. At current levels, new mortgage rates may be approaching 6.5% to 7.0% for new borrowers, pricing out additional home buyers as borrowing costs rise.
Savings Opportunity: Higher Treasury yields benefit savers. Money market funds and Treasury bills now yielding above 3.5% offer genuine returns above inflation for conservative investors. This is the first time in several years that safe assets offer competitive real returns.
Economic Slowdown Risk: Higher long-term rates combined with persistent inflation create a challenging environment for businesses and consumers. Companies with floating-rate debt face higher financing costs. Consumers reduce discretionary spending as mortgage and borrowing costs climb. These pressures may slow economic growth in the second half of 2026.
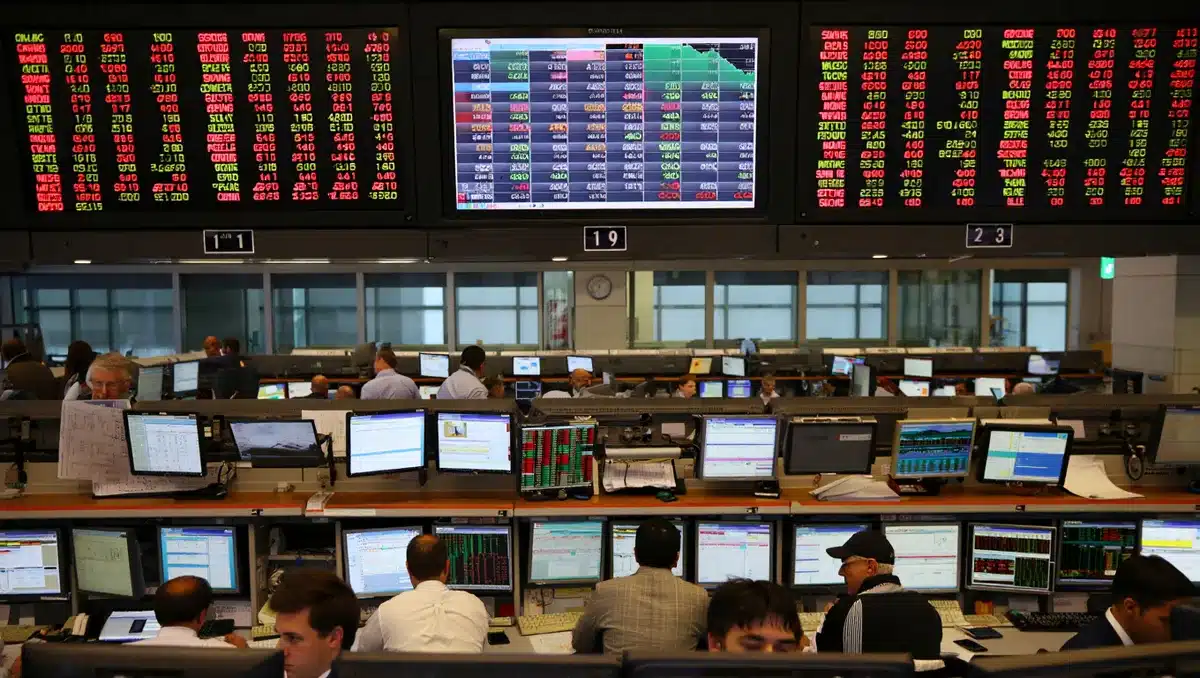
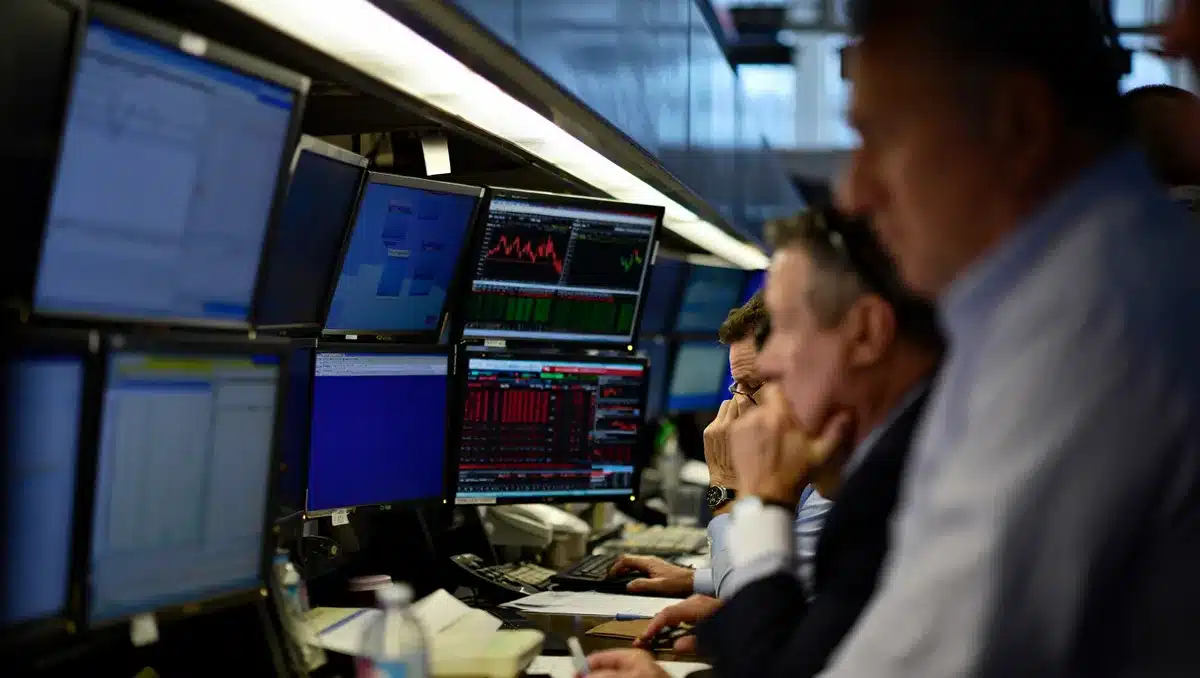
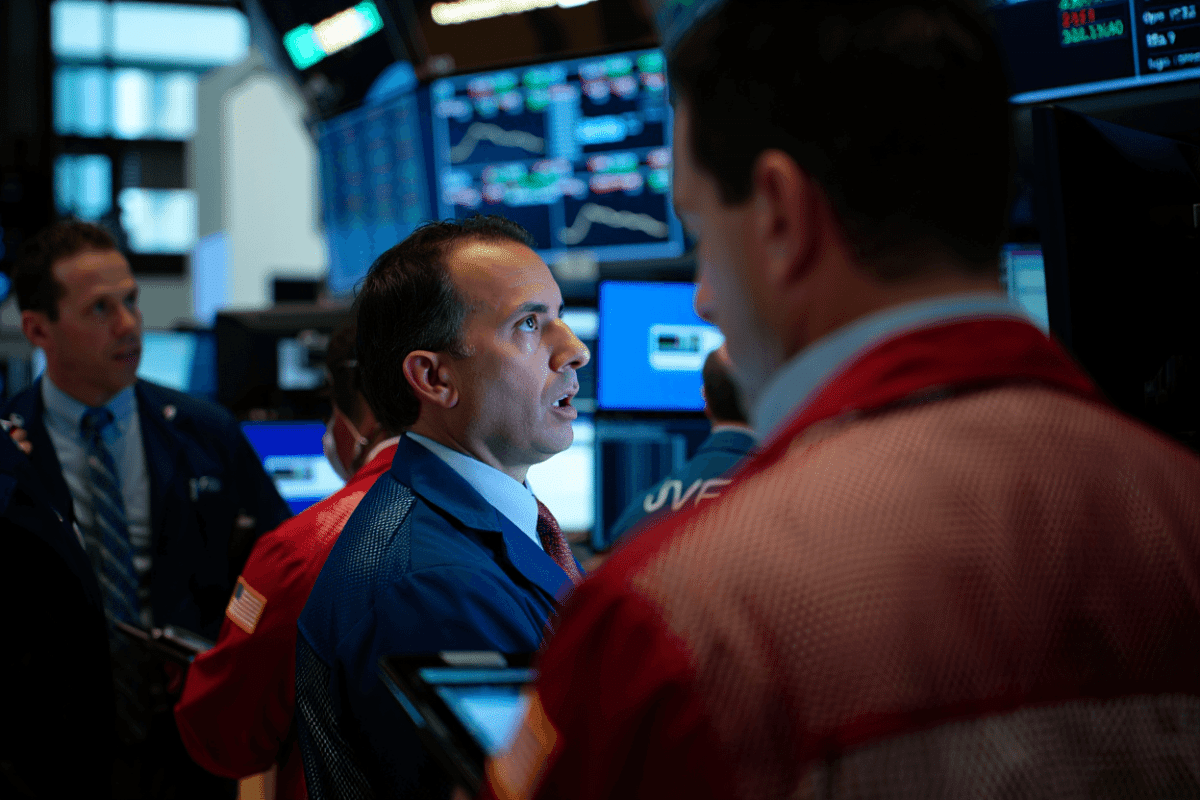
Stock Market Pressure: Rising 30-year Treasury yields reduce the attractiveness of stocks. When safe, guaranteed returns reach 5%+, investors shift capital away from equities. This explains the stock market’s weakness in recent sessions as bond yields jumped.
What Market Participants Watch Next
The critical watch point is whether inflation continues accelerating or begins cooling. If producer price data continues climbing above 5%, more rate increases are possible despite tax cut expectations and political pressure. The next major releases are June CPI and PPI data, which will determine whether this week’s yield surge continues or reverses.
Federal Reserve messaging matters enormously. Chair Kevin Warsh will face questions about whether the “transitory inflation” narrative holds or whether the Fed needs to acknowledge sticky inflation requiring sustained higher rates. His testimony before Congress will be critical market-moving events.
Geopolitical developments remain a wild card. Further Middle East escalation could drive oil to $110+ per barrel, intensifying inflation pressures. Conversely, peace developments could ease energy prices and allow 30-year rates to decline.
Will 30-Year Treasury Rates Continue Climbing, or Is the Peak Near?
Market forecasts show split opinion. Goldman Sachs expects the 10-year Treasury to settle around 3.75% by year-end 2026, suggesting long rates will eventually decline significantly. However, this assumes inflation moderates and the Federal Reserve can begin cutting rates in the second half of the year.
The alternative scenario—that sticky inflation forces rates higher—would push the 30-year above 5.5%. This would depend on continued hot CPI/PPI data, sustained geopolitical tensions, and mounting fiscal deficits requiring higher compensation for investors. April’s budget data showed the government spent $97 billion on interest costs alone—the second-highest expenditure after Social Security—indicating rising debt service represents a growing drag on fiscal capacity.
Most likely, 30-year Treasury yields will remain elevated in the 5.0%-5.5% range through mid-2026 as markets await clarity on the inflation trajectory and Federal Reserve priorities under new leadership.
Sources
- CNBC – “30-year Treasury yield tops 5.1%, highest in nearly a year” (May 15, 2026)
- Trading Economics – Real-time 30-year Treasury bond yield data and 12-month history
- Advisor Perspectives / dShort – “Treasury Yields Snapshot: May 15, 2026” with historical comparisons since 2007
- Federal Reserve – H.15 Selected Interest Rates Daily Release (May 18, 2026)
- Dallas Federal Reserve – Research on mortgage rates and Treasury policy transmission (May 7, 2026)
- Saint Louis Federal Reserve (FRED) – Market Yield on U.S. Treasury Securities historical data series