The VIX has fallen to 17.48, signaling a major shift toward market stability. This drop reflects investor confidence returning after weeks of volatility concerns. Discover what this easing means for your portfolio and market outlook.
🔥 Quick Facts
- VIX Level: Currently trading near 17.48, indicating calm market conditions
- Stability Threshold: VIX below 20 signals reduced fear and heightened investor confidence
- Recent Peak: The index peaked above 30 in March due to geopolitical tensions
- Market Response: Lower volatility typically attracts risk-on trading and equity participation
What the VIX Decline Reveals About Market Health
The VIX retreat to 17.48 marks a significant recovery for equity markets. Just weeks ago, the fear gauge spiked to crisis levels due to geopolitical concerns. Current readings suggest investor anxiety has subsided substantially. Market participants are pricing in reduced uncertainty for the next 30 days.
This easing reflects stabilized economic conditions and restored confidence in corporate growth prospects. When the VIX falls below 20, historical data shows equities tend to perform better. Portfolio managers are shifting toward positive positioning as panic selling has dried up.
The Fear Gauge Explained: How VIX Works
The Cboe Volatility Index, or VIX, measures expected price swings in the S&P 500 over the next 30 days. It calculates implied volatility from stock index options. Higher readings indicate greater fear and uncertainty. Lower readings signal complacency and stability.
Investors call it the “fear gauge” because it spikes when market stress peaks. During the March crisis, it surged to 35, reflecting geopolitical shocks. Today’s 17.48 level shows fear has largely evaporated. Traders are making longer-term bets based on fundamentals, not panic.
Market Volatility Metrics at a Glance
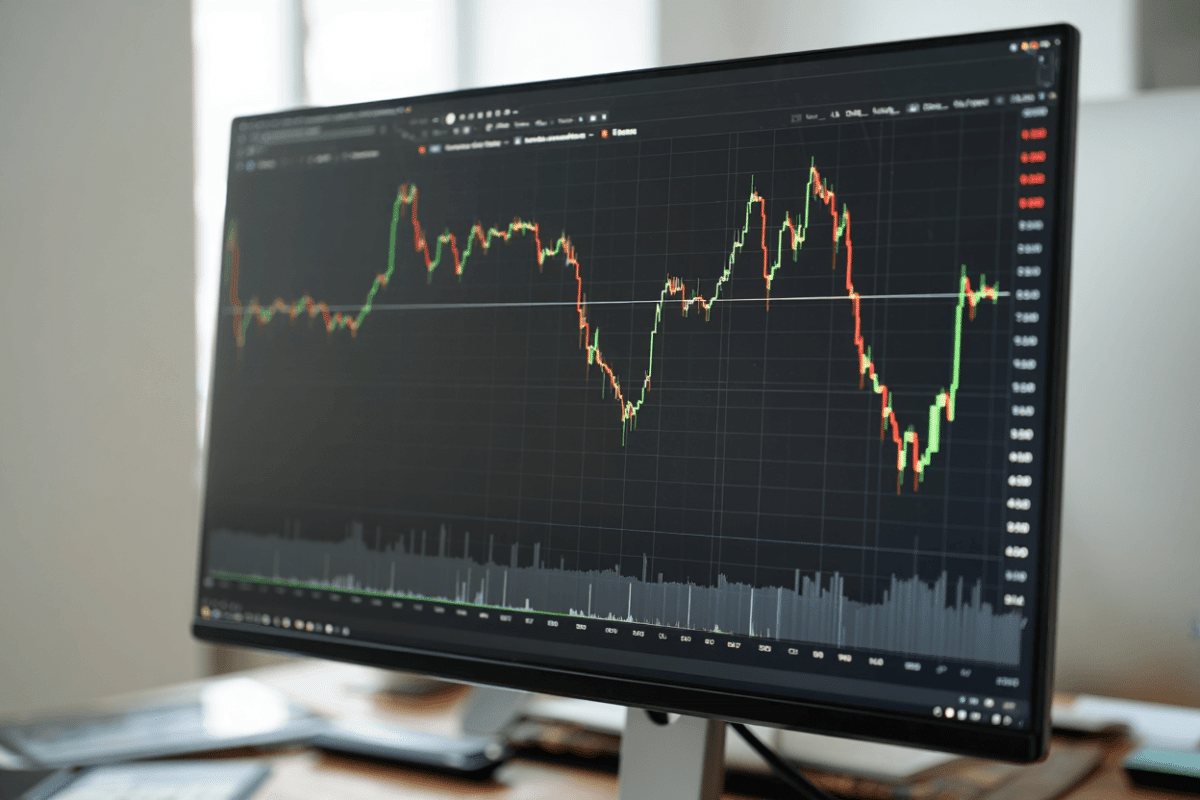
The VIX provides crucial context for investment strategy. Recent weeks revealed sharp swings: the index climbed from lows near 16 to peaks above 30. Current stabilization shows the shock has passed. Investors are reassessing risk, priced into options markets, with confidence returning.
| VIX Level | Market Interpretation |
| Below 15 | Extreme complacency or risk-off sentiment |
| 15-20 | Low volatility, increased confidence (current range) |
| 20-30 | Moderate concern, mixed sentiment |
| Above 30 | Crisis mode, peak investor fear |
The 17.48 reading sits comfortably in the 15-20 range, which historically precedes equity rallies. This suggests conviction among professional traders that major headwinds have passed and earnings growth can resume.
“When the VIX is down it can mean that there is more stability in the market,” according to financial analysis platforms. Market participants use lower volatility readings as a signal to increase equity exposure and take on additional risk.
— TD Bank, Investment Research Division
Why Investors Should Pay Attention Now
The VIX’s fall to 17.48 arrives with important timing. Second-quarter earnings season is approaching, and reduced uncertainty provides clarity for corporate guidance. Management teams can focus on growth without navigating crisis headlines. This environment typically unlocks value in overlooked sectors.
Treasury yields are stabilizing alongside VIX declines. This suggests bond markets also believe rate-hiking cycles may be nearing their peak. When fear subsides across asset classes, it creates momentum for balanced portfolio gains.
What Comes Next: Is 17.48 the New Floor?
Historical patterns suggest VIX readings between 15-20 are sustainable for extended periods if geopolitical risks remain under control. The index could drift lower if earnings surprise positively. Conversely, new shocks could reignite volatility swiftly. Will the gains hold as summer approaches?
Smart investors monitor VIX shifts as early warning systems. Current stability presents a window to rebalance portfolios and lock in defensive positions for potential downturns. When fear is low is when prudent risk management matters most, preventing overexposure during inevitable reversals.
Sources
- Yahoo Finance – CBOE Volatility Index historical data and real-time quotes
- MarketWatch – VIX futures overview and market analysis
- Cboe Global Markets – Official VIX volatility products and methodology