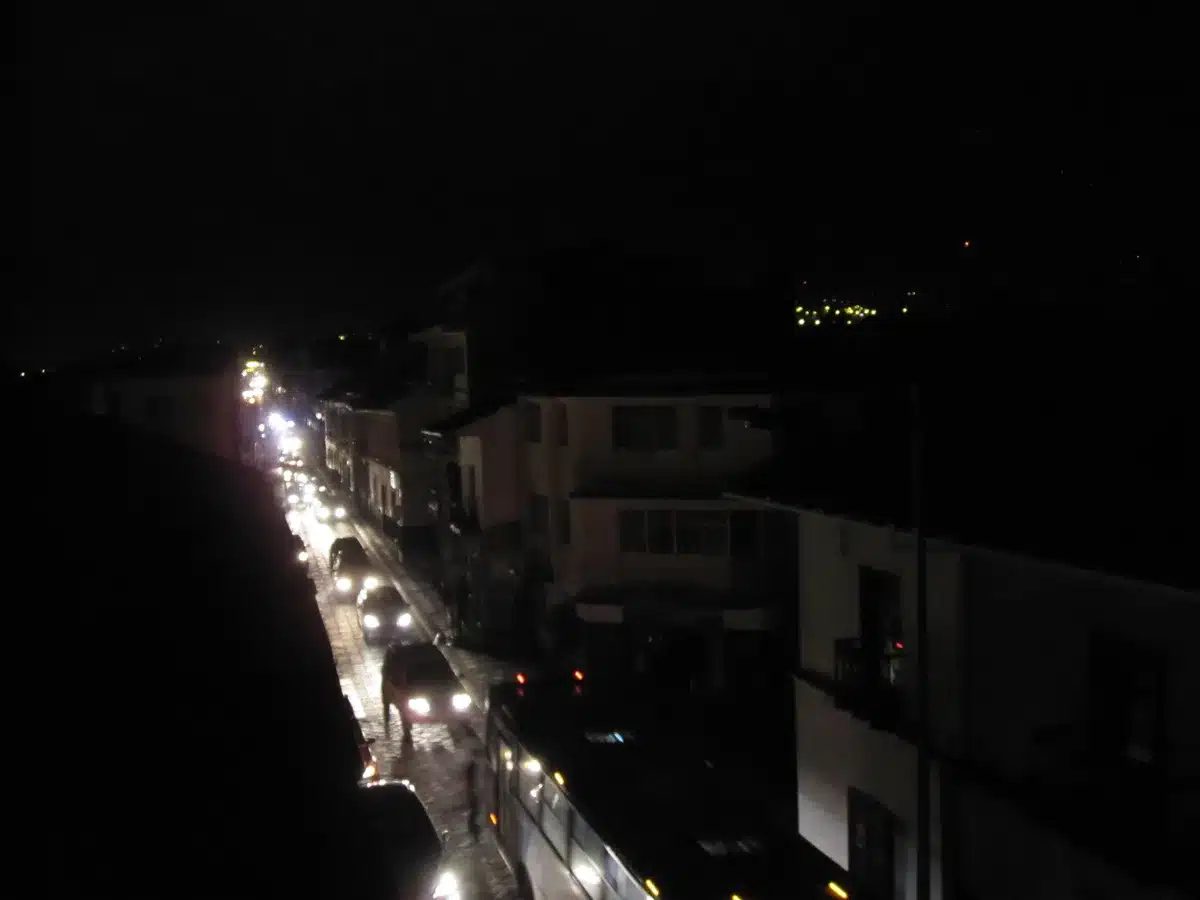
A power outage map tracking nearly 375,000 US customers without electricity illustrates both the scale of recent disruptions and the growing sophistication of real-time grid monitoring tools. An intense August 11 storm knocked out power to nearly 375,000 customers of Northern Indiana Public Service Company, described as the most severe storm event in NIPSCO’s history, affecting approximately 60 percent of the utility’s electric customers across the region.
Multiple platforms now aggregate outage data across the country, updated every 10 to 15 minutes. PowerOutage.us, USA Today’s OFF THE GRID tracker, and tools from utilities and emergency management agencies allow customers and officials to monitor disruptions as they unfold. These maps pull data from over 1,000 utilities nationwide, creating a near-real-time snapshot of grid stress across regions.
The NIPSCO outage underscored the vulnerability of aging infrastructure to severe weather. By August 25, the utility had restored power to 99 percent of customers in northern Indiana, but the extended restoration period prompted a class-action lawsuit and calls for investigation into the company’s preparedness and response.
Weather remains the leading cause of power outages in the United States, accounting for 83 percent of all disruptions, according to energy industry data. Severe thunderstorms, derechos, ice storms, and heat waves can cascade across multiple utility service areas simultaneously, straining grid operators and restoration crews.
The August 2026 NIPSCO outage reflected broader concerns about grid reliability. Experts have warned that the U.S. power grid faces increasing risk of major blackouts due to aging infrastructure, rising electricity demand, and the strain from new data center deployments. A New York Times report from August 18, 2026, noted that the grid relies on thousands of aging, hand-built transformers; if enough fail, a blackout could last years. Some experts have warned of potential blackouts lasting up to 18 months, though others dispute the timeline.
The largest blackout in U.S. history remains the 2003 Northeast Blackout, which affected over 50 million people across the northeastern United States and southern Canada. That outage was traced to a software bug in an alarm system at FirstEnergy’s control room in Ohio, which left operators unaware of the need to redistribute electrical load. When compared to historical precedents, the NIPSCO outage, while severe for the region, affected a much smaller population and was resolved more quickly.
Real-time outage tracking has become essential as utilities and emergency managers work to coordinate response efforts. The maps allow customers to check restoration timelines and help utilities prioritize repairs. As grid stress increases due to climate change and rising demand, these monitoring tools are expected to become even more critical for managing disruptions and communicating with the public.
Sources
- Chicago Tribune — reported the August 11 NIPSCO storm knocked out power to nearly 375,000 customers, described as the utility’s most severe storm event.
- Northern Indiana Public Service Company (NIPSCO) — official statement confirming 99 percent power restoration by August 25, 2026, and that the August 11 storm affected approximately 60 percent of electric customers.
- USA Today — described OFF THE GRID tracker aggregating power outage information from more than 1,000 companies nationwide, updated every 15 minutes.
- New York Times — August 18, 2026 report on grid vulnerability, aging transformers, and potential blackout duration risks.
- Constellation Energy — reported that weather causes 83 percent of power outages in the United States.
- U.S. Department of Energy — documented the August 14, 2003 Northeast Blackout as the largest in U.S. history, affecting over 50 million people, caused by a software bug at FirstEnergy.