The United States surpassed 6 million solar panel installations in 2026, just two years after reaching the 5 million milestone in May 2024, according to the Solar Energy Industries Association. The rapid acceleration underscores solar’s dominance in America’s power grid expansion, with solar and battery storage together accounting for 91% of all new electricity capacity added in the first quarter of 2026.
The U.S. installed 7.8 gigawatts of new solar capacity in Q1 2026, the same quarter that pushed cumulative installations past the 6 million mark. This growth reflects a sustained shift in how Americans meet their electricity needs, with solar now positioned as the nation’s primary source of new power generation.
The acceleration from 5 million to 6 million installations in just 24 months contrasts sharply with the earlier pace of solar adoption. Reaching the first million installations took 40 years, while the second million took eight years. The trajectory has compressed dramatically: the third million took roughly four years, and the most recent million was added in two years. In 2025 alone, a new solar project was installed every 59 seconds, according to SEIA data.
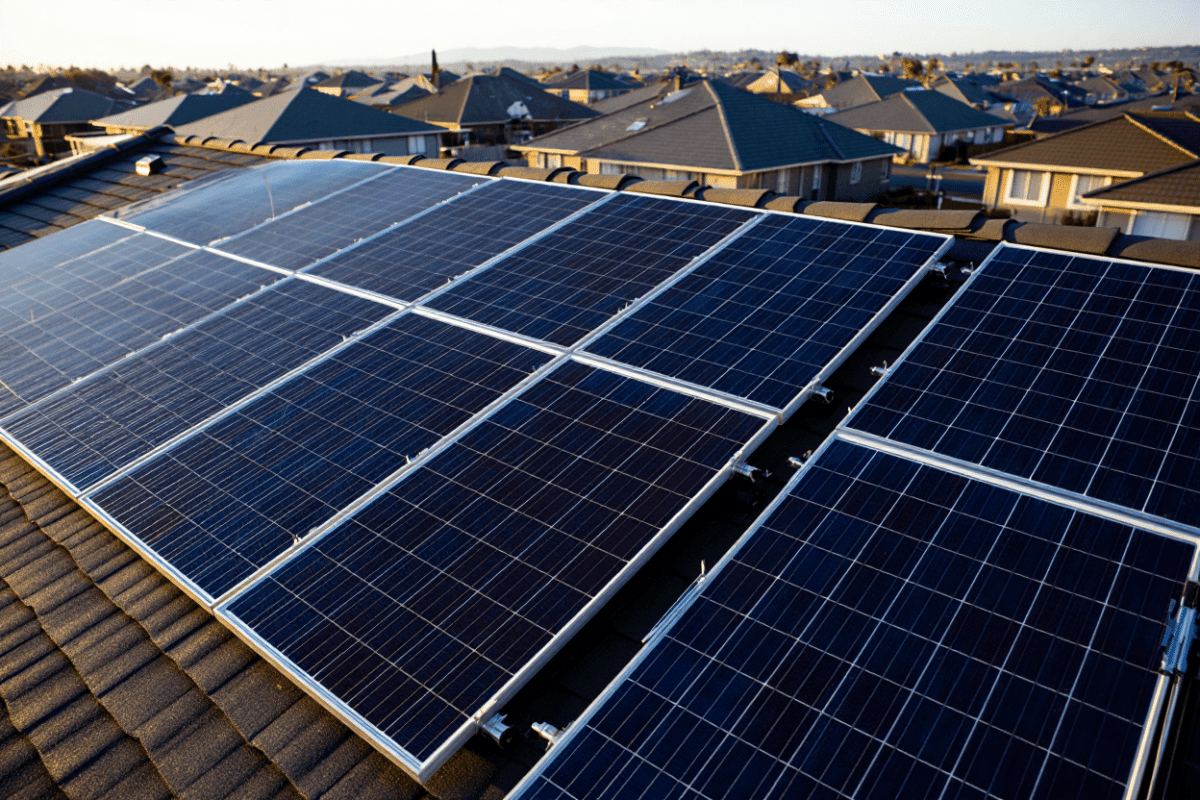
Residential solar dominates the market, with 97% of all U.S. solar installations occurring on residential rooftops. The installed base can now power roughly 50 million American households, and SEIA projects that by 2034, there will be enough solar capacity to power 100 million homes. By 2030, SEIA forecasts there will be over 8 million residential solar systems in the U.S., with 11% of all homes having solar—up from 9% today.
Battery storage is increasingly paired with residential solar. In the first three months of 2026, 45% of new residential solar installations included a residential battery, allowing homeowners to maintain power during grid outages. Energy storage capacity has grown to the point where one full charge could power 5.3 million American homes for a day—more than the combined residential population of New York City and Chicago.
The geographic spread of solar has also widened. Between 2020 and 2026, the number of states and territories with over 100,000 installations more than doubled from 6 to 15. Over the same period, the number of states with over one gigawatt of solar capacity doubled from 18 to 39. In 2025, the top 10 states for solar installations spanned both coasts and the Great Lakes region, signaling that solar growth is no longer concentrated in traditional markets like California.
Despite recent policy headwinds, solar and storage are projected to remain the dominant sources of new U.S. power generation. SEIA forecasts that every year from 2026 through 2030, the solar industry will install an additional 40 gigawatts of capacity, maintaining the momentum that has made solar the fastest-growing energy source in the nation.
Sources
- Solar Energy Industries Association (SEIA) — Confirmed the 6 million milestone, the 5 million milestone timing, Q1 2026 capacity additions, installation rate data, residential solar statistics, storage attachment rates, state-level spread, and forward projections.
- Environment+Energy Leader — Verified the 91% share of new electricity capacity for solar and storage in Q1 2026 and the 7.8 GW of new solar capacity in Q1 2026.
- Wood Mackenzie — Corroborated the 91% figure for solar and storage combined in Q1 2026.